
Microsoft just launched a new profiling tool in Visual Studio 17.2 that helps you understand how you can optimize your File I/O operations to improve performance in your apps. If you’re trying to investigate and diagnose slow loading times, the new File IO tool can help you understand how the I/O operations impact your spent time.
How to use File IO
- Select Alt+F2 to open the Performance Profiler in Visual Studio.
- Select the File IO check box along with any other cooperative tools you might need.
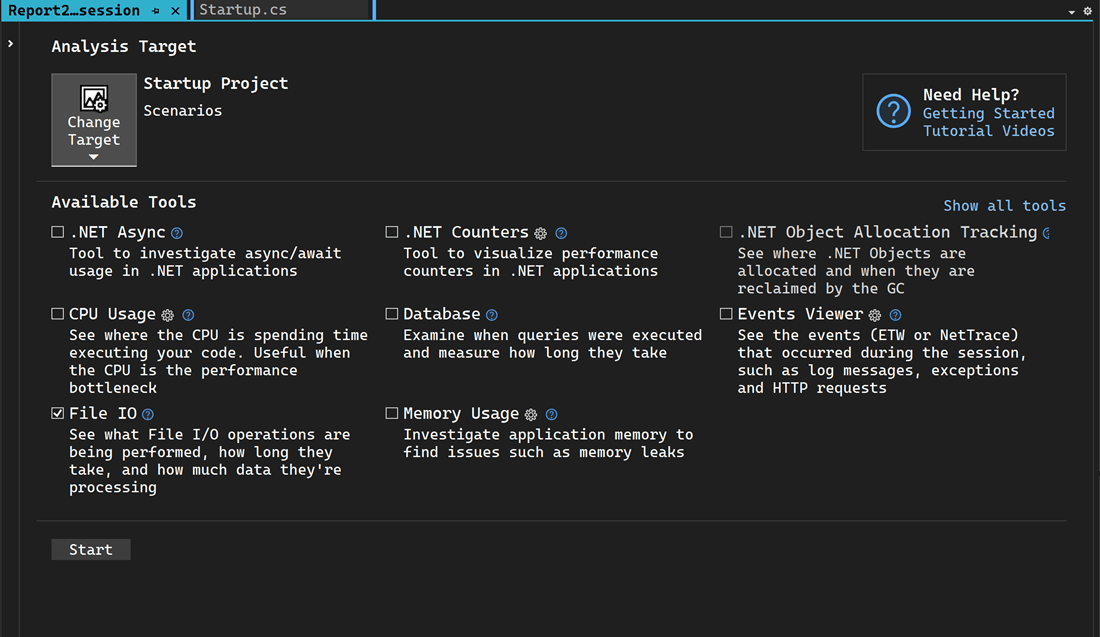
- Select Start to run the tool.
- Select Yes.
- After the tool starts running, go through the scenario you want to profile in your app. Then select Stop collection or close the app to see your data.
View file read and write information to improve perf
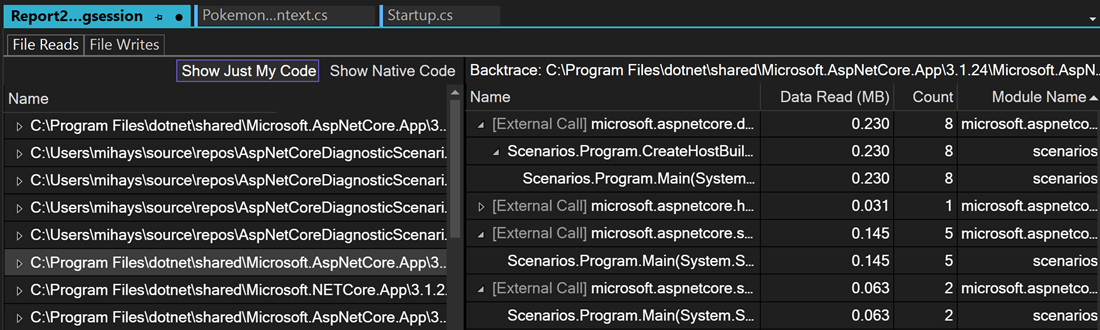
The File IO tool provides file read and write information with files read during the profiling session and can help you diagnose performance issues such as inefficient data read or write patterns. The files are autogenerated in a report after collection and arranged by their target process with aggregate information displayed.
If you right-click on one of the rows, you can go to the source in your code. If an aggregate row was read multiple times, expand it to see the individual read operations for that file with its frequency, if they were read multiple times.

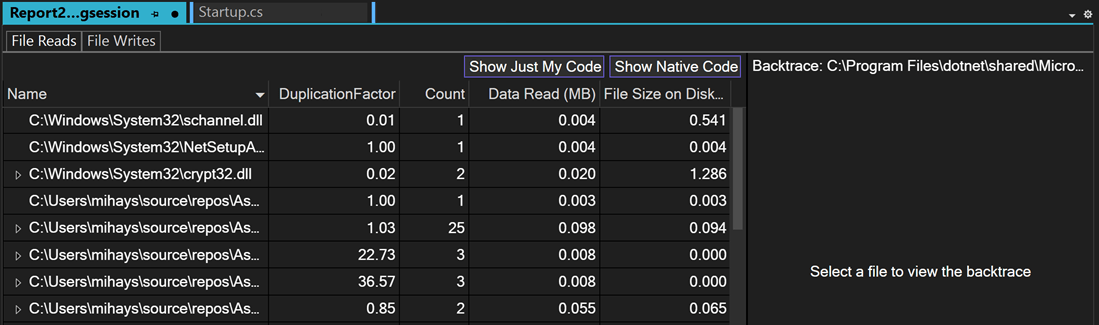
Duplication Factor
The best part of the File IO tool is the Duplication Factor feature because it can help you make informed decisions about where you can reduce the read or processing time. Duplication Factor shows if you’re reading or writing more than what you need to from the file. If you have a duplication factor of 3x, that means the number of bytes you’re reading from the file is 3 times the size of the file itself, which may be an indication that you’re reading, and processing more than you realized. This can indicate a place where caching the result of the file read and processing could improve your app’s performance. 🔥

Backtraces view
Double-clicking any file will cause it to be loaded in the Backtraces view. This view loads for any file in either reads or writes, allowing you to see where the read or write is happening in your code.