In this new post, I introduce an update with labels and OnClickChart event, my ChartJs component for Blazor (Blazor WebAssembly and Blazor Server). This component helps you to create beautiful graphs with the famous JavaScript library for chart called ChartJS. This component is available on:
If you need support, please use the Forum.
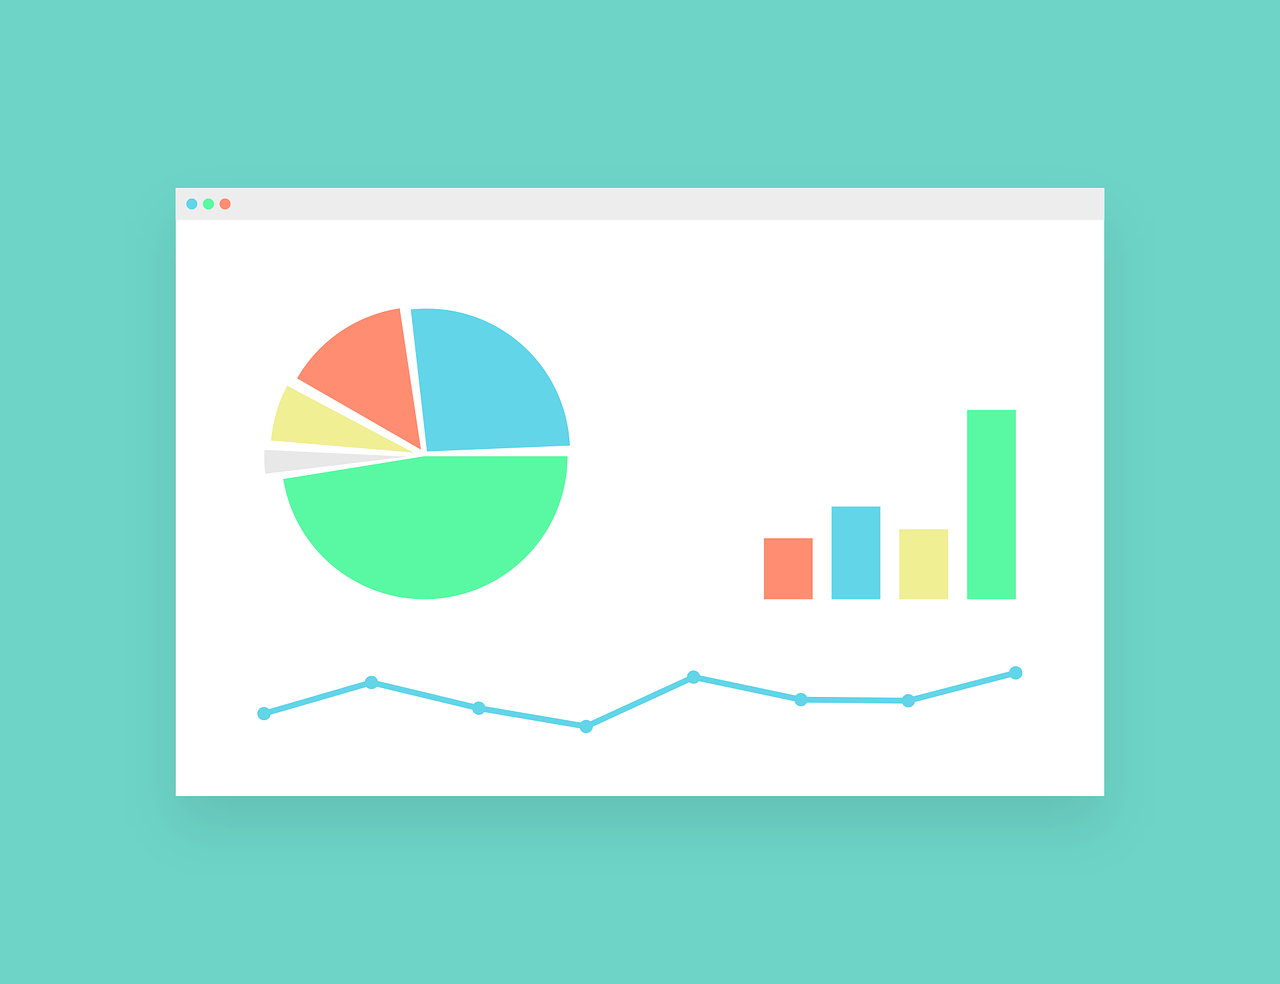
Add labels to the chart
I added the chartjs-plugin-datalabels plugin in the component. This plugin shows the labels for each point in each graph. For more details abour this plugin, visit its website.

First, in the index.html, we have to add after the chart.js script, another script for this component. It is important to add the script for chartjs-plugin-datalabels after chart.js. If the order is different, the plugin could not work. For example
<script src="_content/PSC.Blazor.Components.Chartjs/lib/Chart.js/chart.js"></script>
<script src="_content/PSC.Blazor.Components.Chartjs/lib/hammer.js/hammer.js"></script>
<script src="_content/PSC.Blazor.Components.Chartjs/lib/chartjs-plugin-zoom/chartjs-plugin-zoom.js"></script>
<script src="_content/PSC.Blazor.Components.Chartjs/lib/chartjs-plugin-datalabels/chartjs-plugin-datalabels.js"></script>
In the code, you have to change the property RegisterDataLabels under Options to true. That asks to the component to register the library if the library is added to the page and there is data to show. For example, if I define a LineChartConfig the code is
_config1 = new LineChartConfig()
{
    Options = new Options()
    {
        RegisterDataLabels = true,
        Plugins = new Plugins()
        {
            DataLabels = new DataLabels()
            {
                Align = DatalabelsAlign.Start,
                Anchor = DatalabelsAnchor.Start,
            }
        }
    }
};
With this code, the component will register the library in chart.js. It is possible to define a DataLabels for the entire chart. Also, each dataset can have its own DataLabels that rewrites the common settings.
OnClickChart
When a user click on a chart and in particular on a point with value (bars, point, etc), the event OnClickChart returns the dataset index, the value index in the dataaet and the value.
For example, in this chart the function OnClickChart is called in the event of OnChartClick.
<Chart Config="_config1" @ref="_chart1" Height="400px" OnChartClick="OnClickChart"></Chart>
The function receives ClickValue as parameter that contains the 3 values.
public async Task OnClickChart(ClickValue value)
{
    ClickString = $"Dataset index: {value.DatasetIndex} - Value index: {value.ValueIndex} " +
                  $"- Value: {value.Value}";
}
With this code, if the user clicks on a point, the function writes the values in the page.